How much FIBRE is really in your food,
and why the numbers don’t always match
Introduction
When it comes to measuring fibre in our food, the numbers on the packaging don’t always add up, or match what we see online. So, how can it be that one of the most important ‘nutrients’* for our health still has so many discrepancies with the numbers? Sometimes the nutrition information might display that raspberries have 2.5g or 6.6g of fibre per 100g, and an avocado might have 3.5g or 7g per 100g. The numbers aren’t wrong, but the way the fibre is measured may differ.
Fibre itself has come a long way. Fibre was over-simplistically called ‘roughage’ until around 1950; simply meaning a substance in plants that was undigestible to humans and supported gut motility.
From being a misunderstood nutrient, fibre has become scrutinised in much more detail, understood in ways that we did not think possible, and has potentially become one of the best understood elements on our plate.
Since simply being seen as a substance that helped shunt food gently through our digestive tract, we have now been able to identify different types of fibre and, in doing so, scientists discovered a completely new side to fibre: not only is fibre good for our gut health, but we now know it is critical to our overall health.
The mechanisms of fibre are now well understood as being both direct and indirect.
Directly, fibre itself adds bulk to the food and later stool moving through the small and large intestine, but it can also help to exercise and strengthen the gut wall, improving peristalsis. Fibre can bind to bile salts and other compounds, such as used hormones or waste matter, helping us to excrete them via the stool. It is this mechanism that can help to lower LDL cholesterol and support hormone balance in the body. Fibre also directly affects how quickly food passes through the gut and how quickly macronutrients such as carbohydrates and sugars are absorbed, which can affect blood glucose levels as well as our appetite.
Indirectly, fibre nourishes and feeds the beneficial bacteria living in our colon. Fibre is fermented by the bacteria to make useful bioactive substances which support broader areas of our health. An example of this would be the production of short chain fatty acids (SCFA) which help support the cells lining our gut wall, but they also have a direct effect on inflammation. This means that they can help to lower inflammation levels, not only in the gut, but throughout the whole body.
Methods of testing fibre in our food have changed over time as a result: from the Southgate method in the late 1960’s to the AOAC method used today.
I am going to take you on a brief journey to explain why the history of fibre analysis has been far from straightforward, and why the number on your food label may not match with the numbers you read online.
*Fibre is still mostly classed as a nutrient, although it is not the same as protein, carbohydrates or fats.
There isn’t a single global nutrition database for fibre!
Most of us assume that the fibre content listed on the back of a food packet is a straightforward, agreed-upon figure from one central database, but this is not the case and because techniques have improved over time, different numbers are still being used.
Even setting aside the laboratory methods themselves, there is no single global reference for food composition that all nutritionists, dietitians, food manufacturers, and health authorities have agreed to use. Different countries maintain their own databases, analyse different food varieties, and use different analytical methods, meaning that the fibre figure quoted for, say, an avocado or a tin of lentils can vary substantially depending on which database you consult.
The UK uses CoFid as its main nutrition database, the US, the USDA data. Different countries can use slightly different methods to identify fibre.
So why is fibre so difficult to correctly detect?
What we call ‘fibre’ is not a single compound. It is a broader collection of plant-based carbohydrates and related structures, including cellulose, hemicellulose, pectin, beta-glucans, mucilage, resistant starch, lignin, inulin, and more, each behaving slightly differently in the body, and each requiring different laboratory techniques to detect. The challenge is that no single method captures all of them equally.
Different Laboratory methods.
We must remember that scientists are getting better at identifying more types of fibre in our food, with less margin for error.
As the methods of testing have improved, we have gone from mostly just looking at insoluble fibre, such as cellulose, to being able to pick up the soluble fibre in our foods as well as resistant starches, seeds and lignins. These can increase the amount of fibre in the same food as the techniques for measuring fibre improve too. I will walk you through the various tests in a moment.
Heating and Cooling
The cooking and cooling process also affects the amount of fibre in our food. When starches are cooked and then cooled to lower temperatures (typically below 5̊°C), some, but not all of that starch is converted into resistant starch by a process called retrogradation. Resistant starch is mostly indigestible and behaves more like fibre in the body rather than a food source. Cooking and cooling most carbohydrates, including bread, pasta, rice, potatoes, beans, and lentils allows these to convert some of their starch into this fiber-like state. Resistant starches are important for our health as they help to nourish our gut microbes, in a similar way to soluble fibre. Freezing bread or storing cooked pasta or potatoes in the fridge after cooking will also increase the fibre content.
Pouches and cans: pre-cooked convenience foods
Pre-cooked pouches of lentils, rice, and grains are increasingly popular, and it is worth noting that the pouch-cooking process, which involves high-temperature cooking followed by cooling, may actually produce higher resistant starch levels than fresh home cooking, which may not be picked up on the labelling just yet.
Similarly, popping your tinned or bottled beans in the fridge for 24 hours before using may also increase levels of resistant starches.
Different varieties: different stages of ripeness?
Different varieties of the same food may have a different seed to flesh ratio or the composition of fibre may change during ripening. A great example is visible in bananas. Green bananas contain high amounts of resistant starches that get broken down into sugars during ripening by the enzymes found naturally in the fruit.
How have the laboratory tests improved?
It started with the Southgate method. British chemist David Southgate developed the first method for measuring what he called ‘unavailable carbohydrates’ i.e. the carbohydrates that the human digestive system cannot break down and absorb in 1969.
This method worked by dissolving away everything the body can digest and analysing what remained. It mostly identified insoluble fibre, but also identified several other fractions: including hemicelluloses, some pectin, and lignin. It was a considerable step forward at the time, and its values were incorporated into early editions of McCance and Widdowson’s: The Composition of Foods.
What is insoluble fibre?
Insoluble fibre is the structural scaffolding of plant cell walls. It does not dissolve in water, does not form a gel, and passes through the digestive tract largely intact. Cellulose and lignin are the primary examples.
Insoluble fibre adds bulk to stools, supports bowel regularity, and speeds intestinal transit, which are all important functions, but by no means the complete picture of what fibre does in the body.
Why the Southgate method was not enough
The Southgate method had two significant limitations. First, it struggled to completely remove starch from samples, leading to false highs and inaccuracies. Secondly, while it could include certain soluble fibre fractions such as pectin, it could not reliably separate soluble from insoluble fibre.
The Englyst method: a more complete picture.
In 1982, Englyst and Cummings published a new method that changed the landscape of dietary fibre analysis in the UK. Further refined in 1988 and 1992, this method used enzyme digestion of the starch, so that it could be completely removed, leaving only the part that resisted digestion. This quickly became a far more precise technique than the Southgate method, as it was able to pick up more of the soluble fibre much more reliably.
What is soluble fibre?
Soluble fibre dissolves in water to form a viscous gel in the gut. It includes pectin (found in fruit), beta-glucans (found in oats and barley), and various gums (such as mucilage found in chia or flaxseeds). Unlike insoluble fibre, soluble fibre slows gastric emptying, moderates the rise in blood glucose after meals, binds bile acids (supporting cholesterol metabolism), and acts as a prebiotic food source for our gut bacteria. It is probably the most clinically significant part of dietary fibre as it can help to shape the gut microbiome.
McCance and Widdowson and CoFID
First published in 1940, this pioneering work analysed the nutritional content of British foods just as the Second World War began, providing the data needed to help shape wartime rationing and ensure the population could meet their nutritional needs during food shortages. It remains the UK’s authoritative food composition reference to this day and is now better known as CoFID.
This database has been updated every few years ever since. The latest printed edition (2015) has included both Englyst and AOAC values where available, mixing 2 laboratory techniques. However, in reality, many of the values are still shown as Englyst, meaning it still has limitations in terms of being fully up to date.

The AOAC method: the most accurate data to date.
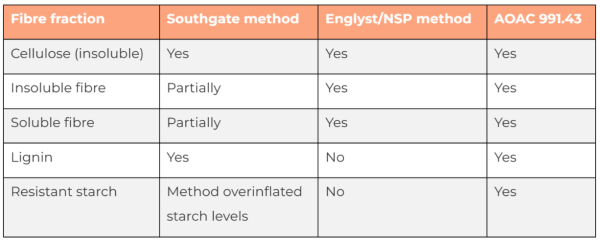
AOAC stands for the Association of Official Analytical Chemists, throwing the net a little wider and picking up everything Englyst accounted for plus resistant starch, lignin, and complex soluble fibres.
Resistant starch (RS): Starch that resists digestion in the small intestine and reaches the large intestine intact, where it is fermented by gut bacteria and acts as a prebiotic. Resistant starch is found naturally in legumes, unripe bananas, and cooked-and-cooled starchy foods, and is a physiologically significant component of dietary fibre.
Lignin: A complex phenolic polymer that forms the rigid structural framework of plant cell walls. It is not a carbohydrate, but it is completely indigestible and contributes to the physical bulk of dietary fibre. Foods such as flaxseeds are exceptionally rich in lignin, and their Englyst fibre values are substantially lower than their AOAC values as a result.
This diagram shows how the methods differ.
UK CoFId vs USA UDSA
The United States Department of Agriculture (USDA) maintains its own food composition database: Food Data Central, which uses AOAC method as its primary analytical method. Because the AOAC method captures a broader range of fibre components than the Englyst method, USDA values for dietary fibre are typically higher than CoFID values for the same food which can lead to some confusion.
Online nutrition analysis Apps
Online nutrition apps are mostly built on USDA / AOAC data, rather than CoFid. This means that USDA recipe analysis will consistently quote HIGHER figures than we see on UK food labels, which are built on CoFID. However, as CoFID uses both AOAC and Englyst figures, we can see how this interim phase of mixed methods can be tricky to navigate.
So what data is used on supermarket packaging?
Since 1999, UK food labelling regulations have recommended the use of AOAC-based methods to align with EU regulations. However, in practice many food manufacturers still use the CoFID calculations, which are often still based on Englyst and CoFID.
Although it is agreed that AOAC is the most encompassing, there are still significant gaps in the CoFID data. This means many foods are still shown with the older Englyst method, so many manufacturers still use the data that is readily available. So, the information on the side of the packet may not be the most up-to-date information.
How I work with fibre data
The honest answer is that I maintain my own working spreadsheets, which I update continuously, drawing on multiple sources: CoFID for UK-specific foods and food labelling reference and USDA with better AOAC fibre coverage, allowing for moving averages based on the information available to use right now.
The goal is not perfect precision, but sufficient accuracy for clinical decision-making, and transparency about the limits of the data.
Differences. Even with best efforts, foods may deviate from any set figures. As I mentioned earlier, cooking and cooling or ripening can also all lead to differences and there is almost always a 10–20% margin of uncertainty in fibre figures, which is realistic for most foods. Nutrition information is therefore always an estimate.
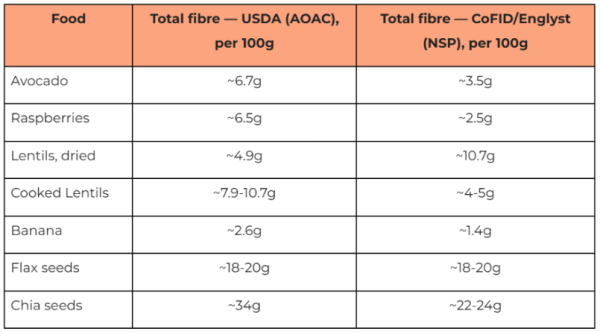
Where the numbers don’t match – real food examples
The best way to understand the practical implications of method variation is to look at specific foods where the figures differ most substantially.
This chart illustrates some of the common differences:
Taken from USDA Data and McCance and Widdowson 2015 (CoFID data).
Summary
As practitioners, our job is not to achieve perfect precision, but to understand the limitations of the figures we use and to communicate them honestly.
As the science develops, AOAC 2011.25 becomes more widely adopted, and CoFID continues to be updated with direct AOAC measurements rather than estimated conversions, the picture will become clearer. Until then, we must use nuance and a No-Nonsense approach to this!
I hope you enjoyed this article,
Dominique
Want to read more about Fibre?
We offer a FREE three day sample of Renew Reset Recharge® so you have the chance to see if this is a compatible programme for you before committing.
Disclaimer
Features published by Dominique Ludwig are not intended to treat, diagnose, cure or prevent any disease. Always seek the advice of your GP or another qualified healthcare provider for any questions you have regarding a medical condition, and before undertaking any diet, exercise or other health-related programme. Please refer to our Terms and Conditions and Medical Disclaimer for more information as well as our Website Terms and Conditions.